Reading Time
4 min
A Look at Houston's Q3 2024 Market Conditions

Johnny Schiro
Broker, Icon Real Estate
Last updated 10/21/2024
Here we are in the last quarter of 2024—almost through the pre-election market trepidation! So how did Houston real estate perform in Q3 of 2024? It could have been better...but it certainly could have been worse. Let’s take a look at the numbers!
We only include residential home sales (single-family, townhouse, and condominium properties) from what we geographcally consider to be the Greater Houston Area. These numbers might differ from the standard HAR-produced reports that you see syndicated elsewhere.
Basic Stats
The vitals for Q3 2024:
Units Sold:
21,207
Average Sold Price:
$428,925
Average Sold Discount:
5%
Average Price Reduction:
2%
Average DOM:
67
Sales have slowed a bit, despite a rising number of homes listed for sale. In 2024’s 3rd quarter we saw 21,207 closings—down 6% versus 22,560 in Q3 of 2023. The units sold metric was boosted by a surprising increase in new homes activity…resale closings actually dropped by 10.6% in Q3.
Sold Listings
21,207
-6% from 2023
Average
$428,925
2% from 2023
Typical
$265k to $475k
$262k to $469k in 2023
Homes Sold per Price Range
A visual price spectrum representation
| $2kto$44k | $44kto$86k | $86kto$128k | $128kto$170k | $170kto$253k | $253kto$336k | $336kto$420k | $420kto$503k | $503kto$586k | $586kto$669k | $669kto$752k | $752kto$836k | $836kto$919k | $919kto$4.4M | $4.4Mto$8.0M | $8.0Mto$11.5M | $11.5Mto$15.0M | |
|---|---|---|---|---|---|---|---|---|---|---|---|---|---|---|---|---|---|
| 2024 | 15 | 150 | 339 | 527 | 3,370 | 5,876 | 3,991 | 2,332 | 1,350 | 893 | 634 | 396 | 273 | 1,042 | 16 | 2 | 1 |
| 2023 | 12 | 141 | 358 | 729 | 3,682 | 6,221 | 4,128 | 2,474 | 1,397 | 963 | 680 | 368 | 285 | 1,023 | 16 | 1 | 2 |
The typical selling price did move up slightly (2%) versus 2023, but that’s mostly due to a small increase in the number of high-priced properties sold. On the distribution above, you’ll notice the ‘bump’ out to the right - that’s mostly because the distribution ‘buckets’ are wider on the edges. The bump includes homes sold between $900k and $4.4M. The core of the market didn’t change much, though we sold 6% less homes than in Q3 2023.
Selling Pace
Time to sell (days on the market, or DOM) is a great barometer for market performance, and this quarter it highlights an obvious slowdown. Average DOM was up 22% versus 2023, and unfortunately it’s not due to the high-end sector skewing the average. Take a look at the DOM distribution below:
Avg Days to Sell
67
22% from 2023
Typical Days to Sell
11 to 88
7 to 66 in 2023
Days on the Market Distribution
The number of homes sold in each DOM range
| to27 | 27to54 | 54to81 | 81to108 | 108to134 | 134to161 | 161to188 | 188to215 | 215to242 | 242to492 | 492to743 | 743to993 | 993to1,243 | |
|---|---|---|---|---|---|---|---|---|---|---|---|---|---|
| 2024 | 9,081 | 3,808 | 2,474 | 1,680 | 1,162 | 791 | 487 | 363 | 295 | 924 | 119 | 21 | 2 |
| 2023 | 11,835 | 3,907 | 2,150 | 1,301 | 828 | 512 | 349 | 309 | 238 | 992 | 51 | 5 | 2 |
Note the significant drop in the number of listings sold in less than 30 days, and the consistent rise in listings sitting for 3-6 months. The good news? An average of 67 days on the market is still blazing fast…and considerably on the ‘seller’s market’ side of equilibrium.
The bad news: DOM is trending in the wrong direction. Note the growing spread between 2023 and 2024 in average DOM by month closed:
Average Days-to-Sell for Each Month
| April | May | June | July | August | September | |
|---|---|---|---|---|---|---|
| 2024 | 70 | 66 | 64 | 64 | 66 | 71 |
| 2023 | 71 | 62 | 58 | 54 | 54 | 57 |
Trends: Number of Homes Sold
The number of sales per month has been a bit choppy this year, as we’ve mostly tracked 2023 except for June and August (which were not pretty in terms of closings.) That can mostly be linked to mortgage rates, as they peaked in May of this year and, on the way down, ramped back up in July before finally coming down to current levels.
Sold Homes by Month Closed
| April | May | June | July | August | September | |
|---|---|---|---|---|---|---|
| 2024 | 7,601 | 8,447 | 7,557 | 7,509 | 7,035 | 6,663 |
| 2023 | 7,361 | 8,721 | 8,817 | 7,602 | 8,000 | 6,879 |
Negotiations & Discounts
The average discount from list price (difference between original list price and actual selling price) did increase by 5% year-over-year, but this one is a bit misleading. It’s actually caused by a reduction in the number of homes sold above list price (left of the white line on the distribution below):
Average
5%
28% from 2023
Typical
0% to 8%
0% to 6% in 2023
Discounts Distribution - From Initial List Price
Number of homes sold from each discount rack
| -45%to-34% | -34%to-24% | -24%to-13% | -13%to-2% | -2%to0% | 0%to2% | 2%to4% | 4%to6% | 6%to9% | 9%to11% | 11%to13% | 13%to15% | 15%to17% | 17%to25% | 25%to34% | 34%to42% | 42%to50% | |
|---|---|---|---|---|---|---|---|---|---|---|---|---|---|---|---|---|---|
| 2024 | 12 | 18 | 41 | 985 | 4,344 | 2,900 | 3,544 | 2,713 | 2,055 | 1,359 | 1,013 | 646 | 448 | 782 | 194 | 50 | 31 |
| 2023 | 9 | 16 | 72 | 1,722 | 5,660 | 3,241 | 3,541 | 2,631 | 1,828 | 1,159 | 821 | 529 | 354 | 573 | 178 | 65 | 28 |
New Construction Homes
Despite the slowing overall market, new home sales in Houston increased by a whopping 9% in Q3 2024 versus Q3 2023. The average price did slide 6% (down to $400k), mainly due to an increase in the number of homes sold in the $200k to $400k range.
Sold Listings
6,070
9% from 2023
Average
$400,570
-6% from 2023
Typical
$285k to $439k
$294k to $453k in 2023
New Homes Sold per Price Range
A visual price spectrum representation
| $90kto$123k | $123kto$155k | $155kto$188k | $188kto$221k | $221kto$276k | $276kto$332k | $332kto$387k | $387kto$443k | $443kto$498k | $498kto$554k | $554kto$609k | $609kto$665k | $665kto$720k | $720kto$2.3M | $2.3Mto$3.8M | $3.8Mto$5.4M | $5.4Mto$7.0M | |
|---|---|---|---|---|---|---|---|---|---|---|---|---|---|---|---|---|---|
| 2024 | 4 | 11 | 71 | 218 | 1,009 | 1,444 | 1,127 | 708 | 459 | 298 | 170 | 145 | 102 | 289 | 13 | 2 | |
| 2023 | 16 | 47 | 151 | 801 | 1,332 | 1,021 | 716 | 417 | 300 | 179 | 145 | 115 | 289 | 18 | 7 | ||
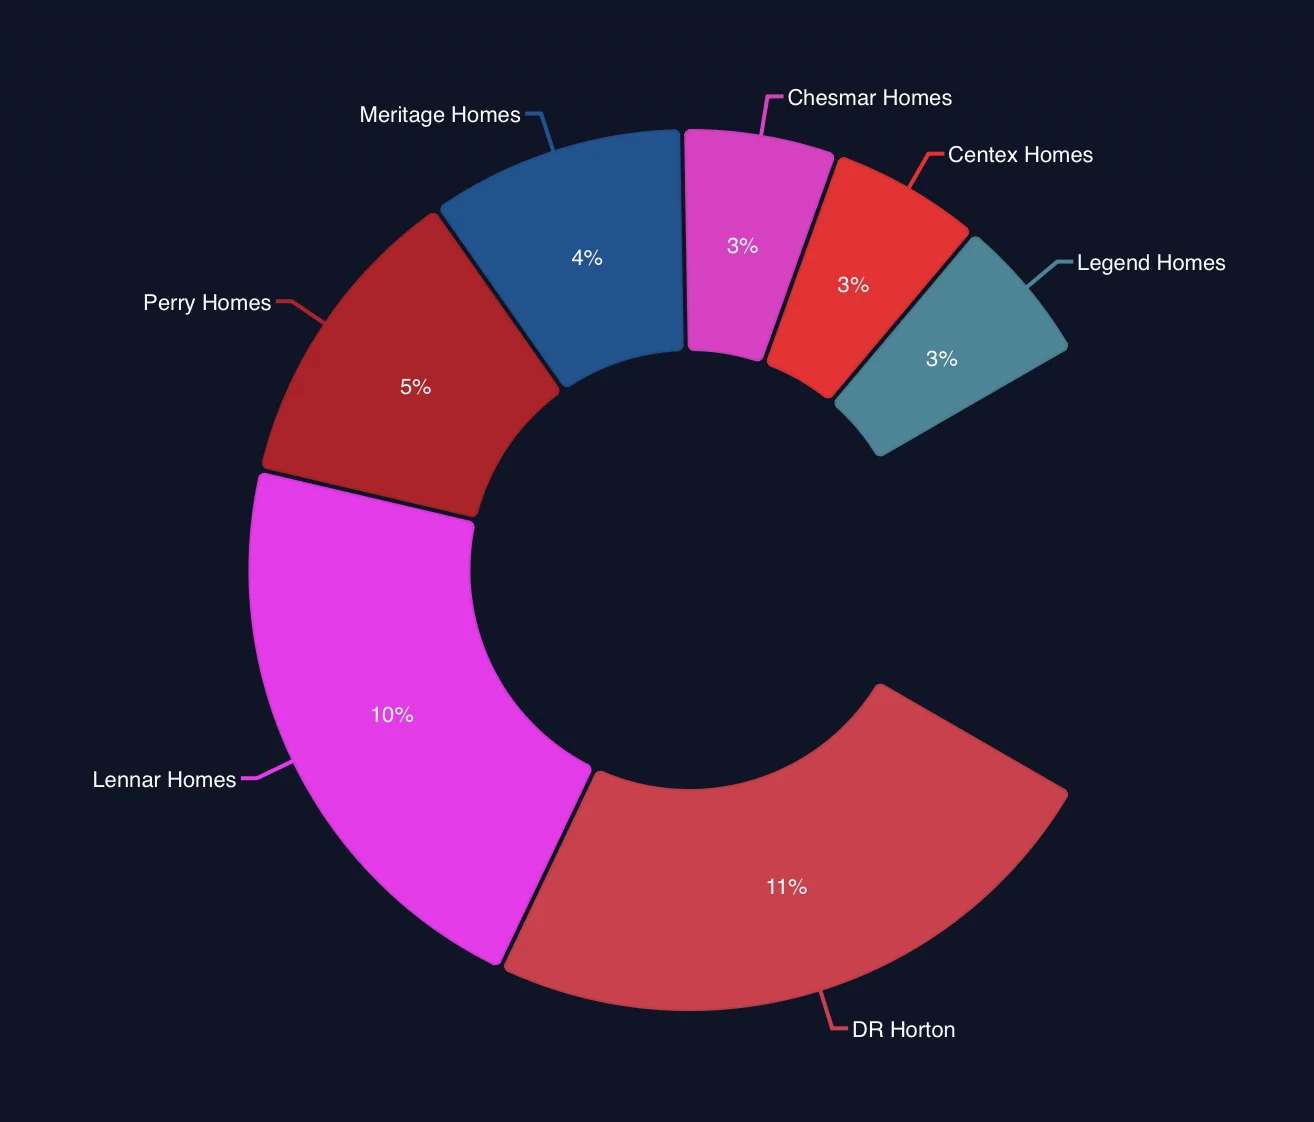
Builder Market Share
The two monsters Lennar Homes and DR Horton claimed a full 25% market share (for units sold) in Q3 or 2024. The usual suspects Perry Homes, Meritage, and Long Lake also made the top 5, with K Hovnanian and Century Communities sneaking in to the top 7 builders for units sold.
Available Units
10,723
Total Sold
6,070
Builder Discounts & Incentives
How’s this for some good news? The average builder new home discount increased by 28% in Q3 versus last year. That is a huge increase, and I’m not really sure if it’s related to builder corporate offices accepting reality…or just a shift in the marketing aspect of list price manipulation. Either way, it’s suggestive of a market that has offered new home buyers much more leverage when it’s time to negotiate. What a shift from just a few years ago.
Check out Newmark Homes with an average discount of 14%!
Average
5%
28% from 2023
Typical Discount
0% to 8%
0% to 6% in 2023
TL;DR
Houston’s real estate market was less than spectacular in 2024’s 3rd Quarter: closings were down 6% overall (10.6% in the resale market), though prices still managed to climb slightly. DOM continues to rise, but at an average of 67 days to sell, we’re still way ahead of equilibrium and, despite common buyer thought, well on the ‘seller’s market’ side of the spectrum.
Great buying opportunities are all around us, and builders are offering serious discounts again. Take advantage…we all know the market surge is coming after the election.
About the author
Johnny Schiro is the broker of Icon Real Estate and an active Houston Realtor. A former electrical engineer, he traded circuits for contracts in 2005 and hasn’t looked back.
Known for sharp, intelligent negotiating and seductive marketing (yep, homes have never looked hotter), Johnny has sold thousands of homes for individuals, families, investors, and builders. When he’s not closing deals, Johnny is a family man, a web dev & crypto nerd, football fanatic (Hook 'em!), and a golf & guitar hack.
Licensed in NY, Florida, and Colorado, Johnny’s “been there, seen that, I'm still in my prime” vibe is unmistakable. He’s seen it all—except a bad day in real estate.