Reading Time
4 min
Houston Real Estate Market Review - August 2024

Johnny Schiro
Broker, Icon Real Estate
Last updated 09/09/2024
The hot Houston summer is wrapping up, so let's take a look at how the market performed in the month of August, 2024!
We only include residential home sales (single-family, townhouse, and condominium properties) from what we geographcally consider to be the Greater Houston Area. These numbers might differ from the standard HAR-produced reports that you see syndicated elsewhere.
Basic Stats
We'll start with vital signs, which look quite normal for this time of year:
Units Sold:
6,956
Average Sold Price:
$424,006
Average Sold Discount:
5%
Average Price Reduction:
2%
Average DOM:
66
The number of homes sold (closed) was down 14% versus last August. Yeah, ouch. But hey, that’s actually better than it feels out there. The price distribution barely shifted—except that $300k peak isn’t quite flexing as hard as it did last year.
Sold Listings
6,956
-13% from 2023
Average
$424,006
1% from 2023
Typical
$264k to $470k
$260k to $470k in 2023
Homes Sold per Price Range
A visual price spectrum representation
| $20kto$56k | $56kto$93k | $93kto$129k | $129kto$165k | $165kto$250k | $250kto$336k | $336kto$421k | $421kto$506k | $506kto$591k | $591kto$676k | $676kto$761k | $761kto$846k | $846kto$931k | $931kto$2.4M | $2.4Mto$4.0M | $4.0Mto$5.5M | $5.5Mto$7.0M | |
|---|---|---|---|---|---|---|---|---|---|---|---|---|---|---|---|---|---|
| 2024 | 12 | 49 | 122 | 165 | 1,117 | 1,976 | 1,324 | 736 | 441 | 278 | 202 | 111 | 75 | 321 | 20 | 3 | 4 |
| 2023 | 4 | 66 | 114 | 221 | 1,320 | 2,212 | 1,489 | 900 | 504 | 357 | 220 | 137 | 110 | 319 | 23 | 1 | 1 |
Take a closer look at that distribution graph above; I'd like to make an important point. This graph is a price distribution, which means it's showing how many homes sold (y-axis) within each price range bucket (x-axis). For example, 1,955 homes closed between $251k and $337k. That's a 28% chunk of the market sold below $337k, despite our average price of $424k.
50% of homes sold between $264k and $470k. Yeah, I’m not sure average means what you think it means either. The real takeaway? That $424k metric is skewed—high-end homes are inflating the stats (and honestly, nobody likes inflation.)
Selling Pace
Moving on! Next, we have the days-on-market distribution, which shows how many homes sold within each 'day range' bucket. The average time-to-sell in August was 66 days—up 21% (ouch) versus last August. But compared to 2023 (the blue area on the graph), really, we just had fewer homes sell in that 0- to 2-week range. The rest of the market really stayed on par with last August.
Avg Days to Sell
66
21% from 2023
Typical Days to Sell
12 to 86
7 to 65 in 2023
Days on the Market Distribution
The number of homes sold in each DOM range
| to27 | 27to53 | 53to80 | 80to107 | 107to133 | 133to160 | 160to187 | 187to213 | 213to240 | 240to404 | 404to567 | 567to731 | 731to894 | |
|---|---|---|---|---|---|---|---|---|---|---|---|---|---|
| 2024 | 2,926 | 1,311 | 804 | 576 | 385 | 241 | 169 | 104 | 90 | 282 | 46 | 15 | 7 |
| 2023 | 4,267 | 1,386 | 706 | 481 | 287 | 174 | 128 | 106 | 84 | 321 | 52 | 5 | 1 |
Negotiations
On to more interesting stuff--the graphic below shows the distribution of sold discount versus original list (e.g., first listed for $500k, sold for $450k = 10% sold discount.) Note the vertical white line on the graph is the zero mark; anything to the left of that line sold above list price.
Average
5%
36% from 2023
Typical
0% to 8%
0% to 6% in 2023
Discounts Distribution - From Initial List Price
Number of homes sold from each discount rack
| -45%to-34% | -34%to-24% | -24%to-13% | -13%to-2% | -2%to0% | 0%to2% | 2%to5% | 5%to7% | 7%to9% | 9%to11% | 11%to13% | 13%to16% | 16%to18% | 18%to25% | 25%to32% | 32%to39% | 39%to46% | |
|---|---|---|---|---|---|---|---|---|---|---|---|---|---|---|---|---|---|
| 2024 | 3 | 5 | 17 | 321 | 1,396 | 1,035 | 1,144 | 894 | 643 | 445 | 330 | 203 | 152 | 230 | 70 | 30 | 17 |
| 2023 | 3 | 4 | 24 | 666 | 2,022 | 1,239 | 1,272 | 928 | 615 | 373 | 281 | 158 | 125 | 169 | 52 | 32 | 13 |
The average for August was only 5%, but that's up 35% from last August! Remember, averages can be deceiving...it's actually not so much that sellers are having fire sales, but really just fewer homes sold above list price. Hit that 2021 button to see how ridiculous things really were just 24 months ago.
A Healthy Market?
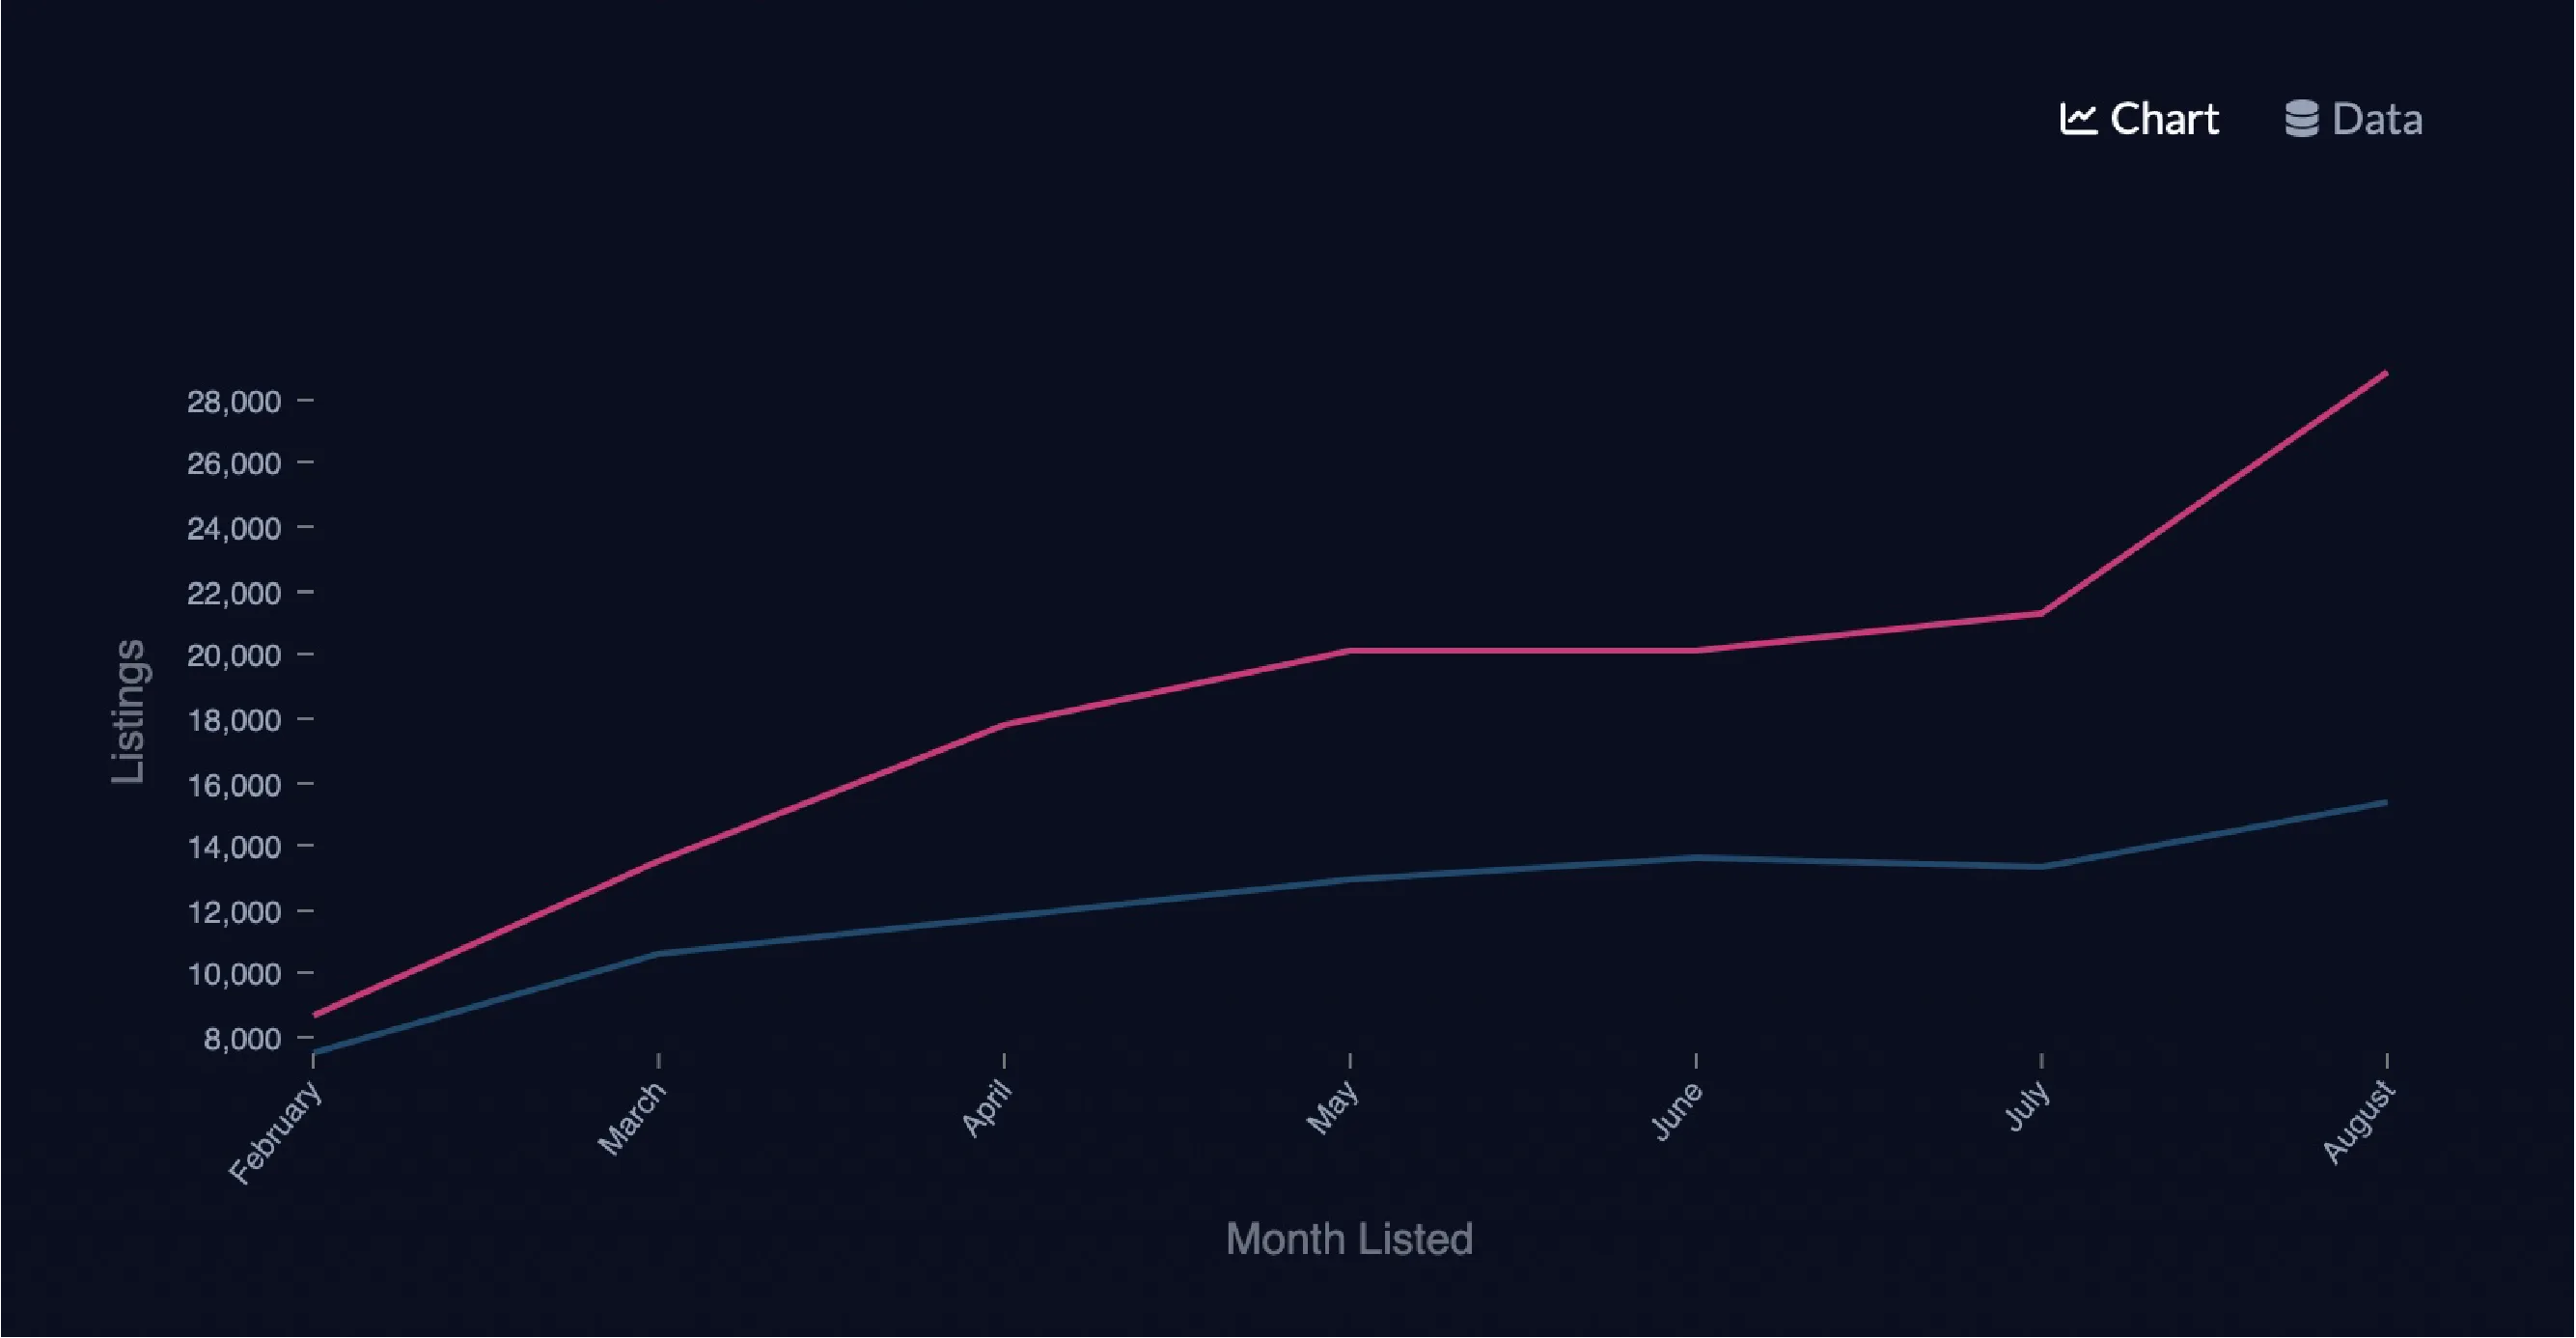
Houston home sellers just might be waking back up! After a very slow July for new listings, we're back to the 2023 level here in August.
Monthly New Listings
| February | March | April | May | June | July | August | |
|---|---|---|---|---|---|---|---|
| 2024 | 8,045 | 9,955 | 11,794 | 12,055 | 12,804 | 12,002 | 15,021 |
| 2023 | 7,579 | 10,542 | 11,631 | 12,814 | 15,208 | 14,759 | 15,048 |
Pending sales for August also caught back up with last year (again following a depressing July.) Note the weirdness in this year's trend line: we missed the July spike.
New Pending Contracts per Month
Tracking the number of homes that go from active to pending, by month
| February | March | April | May | June | July | August | |
|---|---|---|---|---|---|---|---|
| 2024 | 5,946 | 8,303 | 8,735 | 7,935 | 7,946 | 7,038 | 4,384 |
| 2023 | 6,377 | 8,987 | 8,804 | 8,720 | 8,863 | 11,624 | 5,044 |
Closing in August were not on par with last year, but that's expected since we missed the July spike in pending contracts. September's closing numbers should be relatively in line with 2023.
Sold Homes by Month Closed
| March | April | May | June | July | August | |
|---|---|---|---|---|---|---|
| 2024 | 6,655 | 7,601 | 8,447 | 7,557 | 7,510 | 6,956 |
| 2023 | 7,916 | 7,361 | 8,721 | 8,817 | 7,602 | 8,000 |
Home builder pricing
Builders offered better deals in August--likely due to a disappointing July. Below we have our Houston builders top 10 by average discount - it's still nothing like pre-2020, but builders are definitely becoming more flexible. The average new home sold at about 95% of original list price...and while that's pretty thin, it's still a 35% increase versus last year's summer-ending month.
Average
5%
36% from 2023
Typical Discount
0% to 8%
0% to 6% in 2023
Lennar homes is leading the way at an average 13% discount from the original list price. That means they’ve agreed to some serious price reductions—see the actual distribution here: Lennar Homes Statistics.
What does it all mean?
So in summary - we do have a softer market than we did a year ago. But contrary to what seems to be common opinion, we're nowhere near a 'buyer's market.' The single-family homes market here in Houston is moving faster than it feels, and the new listings growth is actually promising. There are absolutely deals and opportunities out there--both for homebuyers and investors. Take advantage while you can!
About the author
Johnny Schiro is the broker of Icon Real Estate and an active Houston Realtor. A former electrical engineer, he traded circuits for contracts in 2005 and hasn’t looked back.
Known for sharp, intelligent negotiating and seductive marketing (yep, homes have never looked hotter), Johnny has sold thousands of homes for individuals, families, investors, and builders. When he’s not closing deals, Johnny is a family man, a web dev & crypto nerd, football fanatic (Hook 'em!), and a golf & guitar hack.
Licensed in NY, Florida, and Colorado, Johnny’s “been there, seen that, I'm still in my prime” vibe is unmistakable. He’s seen it all—except a bad day in real estate.